The Ishikawa, or Fishbone, diagram (or, affectionately known as the “Fishikawa” diagram), is one of the easiest diagrams to create. No special software is needed, per se. The content for the Ishikawa diagram is constructed using The 5 Why’s as discussed in the previous post. The answer to each question can be classified under one of six outside factors which makes up a bone from the fish’s scale. The six factors are described in the following table.
| Method | Methods are ways of doing things or the procedures followed to accomplish a task. A typical cause under the Method category is not following instructions or the instructions are wrong. |
| Man | People are responsible for the problem. The problem may have been caused by people who are inexperienced, who cannot answer prompted questions, and so on. |
| Management | Management refers to project management; poor management decisions, such as upgrading two components simultaneously rather than deploying changes serially may cause technical problems. |
| Measurement | Measurement refers to metrics that are derived from a project. Problems may occur if measurements are wrong or the measurement technique used is not relevant. |
| Material | Material basically refers to a physical thing. A bad diskette is one typical example. Software can't always handle errors caused by bad material, for instance a bad backup tape, so while material may be the least likely cause, it is a possible cause. |
| Machine | A machine in software usually refers to the hardware, and there are a lot of possibilities that a problem can be due to the machine, such as performance issues. |
Based on the problem scenario in the previous post regarding running out of gas, we could create a Ishikawa diagram like the following. 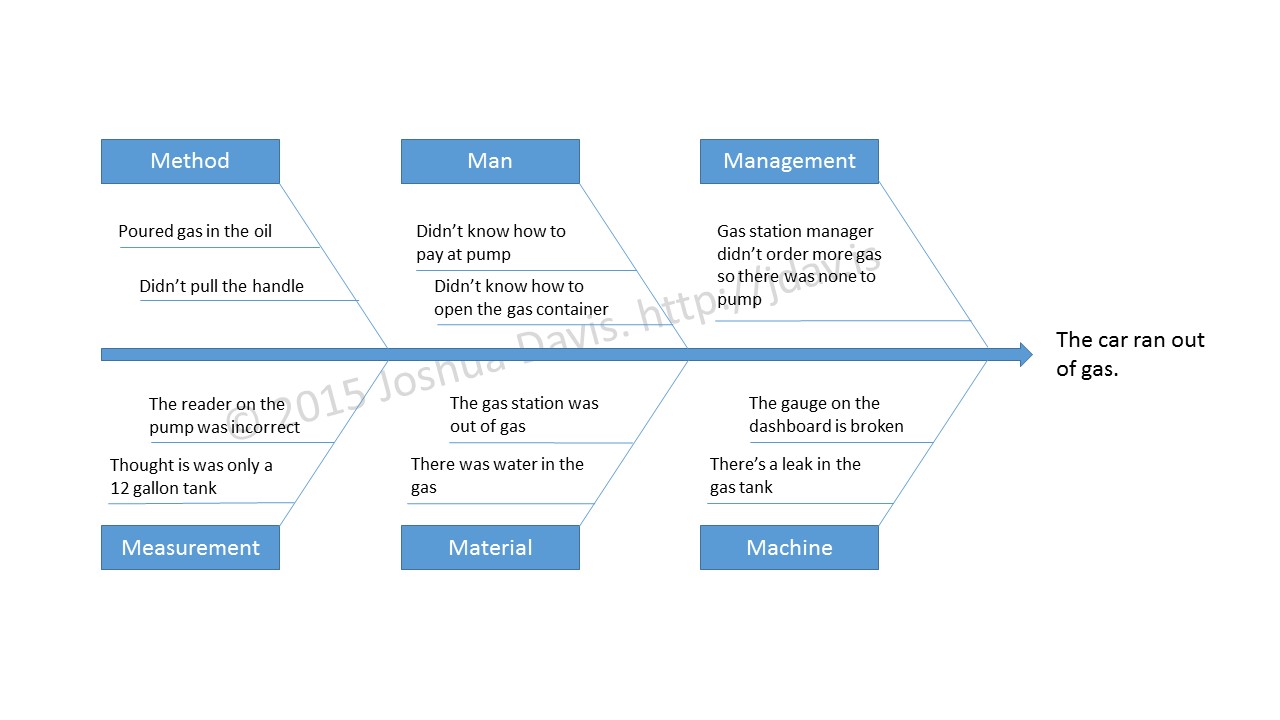
(click on image to enlarge)
Sample Reports
- Ishikawa (“fishbone”) Diagram
- Check Sheet
- Stratification (alternatively, flowchart or run chart)
- Control Chart
- Histogram
- Pareto Chart
- Scatter Diagram